
Free Hydrology Data Without the Hassle: Where to Download and Start Working
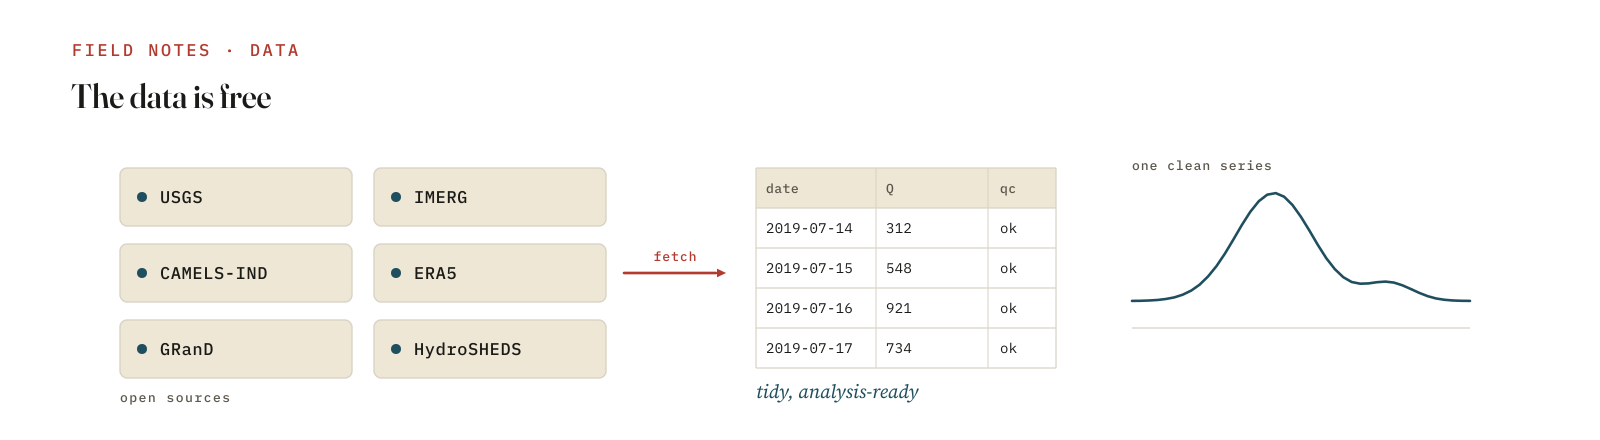
The data is free. The hassle is the plumbing — accounts, formats, undocumented APIs, half a gigabyte of HDF5 you have to clip before you can even plot it. Most people lose a day here before they do any hydrology. This is the catalogue I wish I’d had: what’s free, and the client library that fetches it so you can skip the click-through and start working.
Streamflow and reservoirs
- USGS NWIS — US streamflow, stage, peaks, ratings. Don’t scrape the
website; use the
dataretrievalpackage (Python and R). One call returns a tidy dataframe. - GRDC — the Global Runoff Data Centre, the standard source for international discharge records.
- CAMELS / CAMELS-IND — large-sample catchment datasets with streamflow plus catchment attributes already attached. CAMELS-IND covers Indian catchments and is what I use for regional machine-learning work; it saves you weeks of attribute assembly.
- India-WRIS / CWC — the national portals for Indian discharge and water resources data.
- GRanD and ResOpsUS / Global Reservoir Storage — reservoir locations, capacities, and operational storage time series. GRanD underpins my own work on global reservoir recovery.
Precipitation
- NASA GPM IMERG — half-hourly, 0.1° global satellite precipitation. (I keep a small toolkit for downloading, clipping, and analysing it — see my other post.)
- CHIRPS — daily, rainfall-focused, long record; excellent for drought and trend work in data-sparse regions.
- ERA5 — the Copernicus reanalysis; precipitation plus every other forcing
variable, fetched with the
cdsapiclient. - IMD gridded — India Meteorological Department gauge-based gridded rainfall (0.25°), the ground truth you validate satellite products against.
- NOAA GHCN — global daily station records.
Terrain, soils, and land
- HydroSHEDS / MERIT Hydro — hydrologically conditioned DEMs, river networks, and basin boundaries. This is where catchment delineation starts; my own geomatics toolkit conditions DEMs and extracts stream networks from exactly this kind of data.
- SRTM and Copernicus DEM — global elevation.
- SoilGrids — global gridded soil properties. ESA WorldCover and MODIS — land cover and vegetation.
Evapotranspiration, drought, and storage
- MODIS ET — global evapotranspiration.
- GRACE / GRACE-FO — total water storage anomalies; indispensable for groundwater and drought.
- SPEI / SPI global databases — precomputed drought indices if you don’t want to roll your own.
The four habits that kill the hassle
- Use the official client, not the browser.
dataretrievalfor USGS,cdsapifor Copernicus,earthaccessfor anything behind NASA Earthdata. These turn a download session into one function call. - Authenticate once, store credentials in the environment. A NASA Earthdata
login in a
.netrcor environment variable means your script runs unattended. Never hard-code a password into a notebook. - Cache locally. Hit the API once, save the response, and read from disk afterwards. My flood-analysis utilities cache every USGS and NOAA pull so a re-run costs nothing and works offline.
- Clip early. Subset to your basin shapefile (in EPSG:4326) the moment the data lands, before you analyse anything. A continental raster becomes a manageable NetCDF, and everything downstream is faster.
There’s also a growing amount of this on AWS Open Data and Google Earth Engine, where you can query and compute without downloading at all — worth it once your study area gets large.
Free data is one of the quiet superpowers of modern hydrology. The barrier was never cost; it was the plumbing. Learn the clients, cache aggressively, clip early — and spend your day on the water, not the wrangling.